


A proposal can tell you everything.
How serious the buyer is. If the deal is heating up — or quietly going cold. Who's really making the decision. What they think about the price. What they think about you. Where they're stuck. And when you need to step in.
Now imagine that information x 742,137 proposals.
At Proposify, we don't just imagine that information, we live in it. Every year we analyze what's happening inside all the proposals sent through our platform to uncover what gets sent, what gets read, what gets shared, what gets signed, and what gets a painful hard pass.
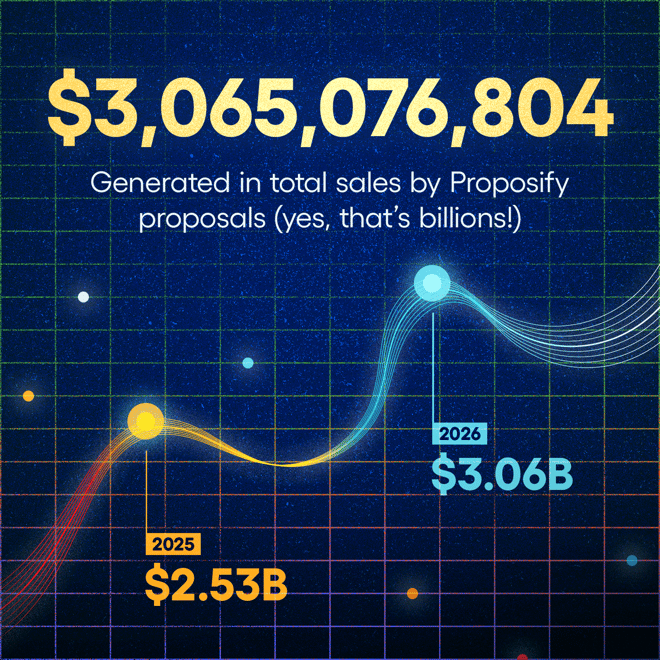
742,137 proposals. 30 industries. $3.06 billion in sales value.
Proposals aren't static documents. They're live buying environments. Speed gets it out the door (hopefully before your competition). But a strong process, a compelling proposal, and knowing how to read the signals it sends back — that's what gets it over the line.
The teams that win do all three well.
This is the 2026 State of Proposals. Everything we know about the most powerful document in your sales process and what to do with it.


The Big Picture
Let's start with the big numbers that lay the foundation for this year's report. Then we'll dig into what they reveal.


Build a Winning Proposal
A standout proposal isn't just easier to read, it guides your prospect seamlessly from problem to solution to signing. It engages them, impresses them and makes your deal impossible to ignore.
Page Count: Concise Closes Deals
While the data showed a trend, there’s no real one-size-fits-all proposal length. It depends on the complexity, the deal size, and sales stage. The key is to kill the clutter and focus on what matters: how you solve their problem.

Proposal Sections: The Building Blocks of a Win
Which sections show up in winning proposals and where do buyers actually spend their time?

Most common sections in won proposals:
1. Cover Page
2. Executive Summary / Introduction / Project Summary
3. Approach / Solution / Our Process / Overview & Goals / Scope of Work
4. Deliverables / Products / Timeline
5. About Us / Our Team / Team Bios / Why Us?
6. Pricing / Your Investment / Fee Summary / Quote / Budget
7. Terms & Conditions / Sign Off / Next Steps / Acceptance
The Pricing Page Myth
"They only read the pricing page" is one of the most common excuses for a lazy proposal. Our data says otherwise.
Yes, they probably check the pricing page first, but our data shows they don't stop there. This means every page of the proposal is either building your case or quietly undermining it. Make the whole proposal count.


Images: If Looks Could Close
Proposals aren’t just about what you say—it’s about how you show it.
Visuals:
- Keep buyers engaged by breaking up text-heavy pages
- Make your brand look sharp with polished, professional design
- Show (off), don’t just tell—let headshots, product shots, and portfolios do the selling
This number has been pretty consistent year over year which means visual proposals are table stakes now.

Video in Proposals: Sell When You're Not in the Room
Most proposals get passed around your prospect's buying committee, but you're not always there to pitch. Video changes that.
Only 20% of proposals include video. That's a significant missed opportunity.
Because when a buyer actually watches your video, something remarkable happens: it increases the chances of closing by 3.3X!
Video isn't just a nice touch. It's an engagement signal. If someone watched your video, they're paying attention, and that attention is worth acting on.

Interactive Pricing Tables: Let Buyers Build Bigger Deals
When buyers can adjust quantities, add or remove features, select upgrades, and see real-time pricing changes, something shifts. They stop evaluating your proposal and start building their version of it. That's when deals get bigger and easier to close.

For businesses selling recurring services, the impact on deal value is even more dramatic. Proposals with recurring fees enjoy an 18X lift in deal value.
Give buyers control and they're more likely to say yes and spend more when they do.

Smart Forms, Smoother Deals
Adding fields for contact details, billing information, project specifics, and key roles keeps buyers engaged and eliminates unnecessary back-and-forth.
You’ll need this info in your CRM anyway, so capture it upfront and make closing and project kick-off seamless for everyone.

Take the 2026 State of Proposals Report with you.
Put ideas into action to 2X your close rate by grabbing our downloadable version of the 2026 State of Proposals Report.
Data and insights from over 740,000 proposals – what more could you ask for?


THE PROPOSAL JOURNEY
From creation to close, here's what a tight proposal process looks like. Because every bottleneck doesn't just cost you time, it costs you deals.

17minutes
Average time to create a proposal.


34minutes
Average time from when the proposal is sent until prospect opens it. (that's 2X faster than last year!)


2.5days
Average time from when the buyer opens the proposal to the deal being closed:won.


Inside the Deal
What happens between send and close, and how your next move determines the outcome.
Proposal Views: The Clues to Closing
If you're not tracking how often your buyer views your proposal, you’re missing key signals that can make or break a deal.

Buyers who are serious keep coming back to your proposal. They share it internally. They spend time with it. Every view, every minute spent is a signal that the deal is alive and a sign that it's time to make your move.

Multi-thread or Miss Out
Most deals aren't approved by one person, even if you only sent your proposal to one.

Multi-threading your deals and engaging multiple stakeholders early helps build momentum by:
- Aligning the team on the problem you’re solving
- Creating internal champions who help sell the deal for you
- Reducing the risk of a single point of failure
Find out early who else is involved in the decision and make sure your proposal gets in front of them. And if you can see multiple people viewing it in your analytics, pay attention. The deal is moving internally. That's your signal to follow up.
Deal Revisions: The Back-and-Forth Buying Signal
When a buyer asks for changes to your proposal, that's not a problem. That's a deal in motion.
Buyer-requested revisions are a clear indicator of engagement. It’s an opportunity to get on a call, understand what's behind the ask, and move the deal forward.
Don't be afraid of the back-and-forth. It's not the deal falling apart. It's the deal coming together.

What about Discounts?
Sometimes the revision a buyer requests is about price. Conventional wisdom says discounting means leaving money on the table. Our data says otherwise.
Discounting isn't giving something away. It's a sign of a real negotiation on a real deal. The buyers who push back on price aren't the ones walking away, they're the ones buying.

E-signatures: Sign it, Send it, Close it.
When a buyer is ready to say yes, the last thing you want is friction.
Chasing signatures via email, waiting for someone to print, sign, and scan — every extra step is an opportunity for doubt to creep in and momentum to die.
E-signatures remove that friction at exactly the right moment.

But here's the stat that really stands out this year:

It's a small act that signals confidence. You're not waiting to see if they're interested. You're already committed. And buyers notice.

How Does Your Business Compare?
Close rates, deal values, and time to close benchmarked across industries and company size so you can see where you stand and where you need to go.
Close Rate by Industry - How does your close rate compare?
While Proposify users enjoy an impressive 34% average close rate overall, we've discovered that number can swing dramatically depending on your industry and deal size. In fact, some industries are seeing close rates up to 3X higher than the average!

Close Rate by Company Size: Does size matter?
We were curious if bigger really is better when it comes to closing deals. Turns out, company size does impact close rates, but not always in the way you might expect.

Time to Close - How fast are deals moving in your industry?
Speed matters in closing deals, but what's "fast" in consulting might be glacial in tech. Is your sales cycle dragging compared to your competition?

Deal Value by Company Size - Are you leaving money on the table?
Wonder how the size of your deals stack up against similar-sized organizations? Finding your spot on this chart helps set realistic expectations for your proposals.
But don't be limited by these averages! Throughout this report, we highlight strategies used by companies that consistently secure deals well above their size bracket's typical range. Understanding these benchmarks is your first step toward exceeding them.

Close Rate by Deal Value
See how close rates break down across deal sizes — and where your proposals stack up.

The Next Deal is Yours to Close
Every deal ends up in one of three places — won, lost, or ghosted.
Our data is clear about what puts you in control of that outcome:
-
A friction-free proposal process.
-
A compelling proposal.
-
Knowing how to read the buying signals your proposal sends back.
742,137 proposals don't lie.
The teams that close more deals aren't working harder, they're working smarter.
They're building proposals that engage, impress, and make it easy for buyers to say yes.
They're watching what happens after they hit send. And they're acting on what they see.
That's what Proposify is built for.