


Published: December 20, 2018
Updated: September 18, 2025

Impress your CEO with the 8 sales metrics that matter using our free, interactive template to present those KPIs in an easy-to-understand graphic sales report.
Oh, the dreaded eye flick.
You know what I’m talking about: You’re sitting with your company’s CEO, updating them on your sales team’s KPIs. They nod politely as you start explaining your annual run rate. That’s when it happens: their eyes flick from the screen.
Feel the twinge thunking in the pit of your stomach? That’s recognition hitting. You know their busy mind is already moving on; no matter what you do from here you’re only getting a fraction of their attention.
Good luck impressing them now.
It’s not like your CEO doesn't care what sales is doing. They actually care a great deal. They just happen to have a million other things clamouring for their attention.
Your CEO is a big-picture person who needs to take in a lot of information quickly. They don’t have the time or energy to squint at columns of sales figures or a bloated sales dashboard. They want reports that give them quick, high-level insights, so they can figure out what needs their attention (hopefully nothing) and deal with it.
Proposify’s own CEO Kyle Racki says it best: “There are thousands of metrics my managers could show me—but only a handful I actually care about.”
If you want to impress your own CEO, you need to show them the stuff that really matters to them, and not waste their time with anything else.
Kyle says there are only eight performance indicators he wants to see in a sales report—and they’re all things you probably track already.
To help you create your own sales report that delivers exactly what your CEO wants to see, we created a free interactive template that displays those top eight metrics in easy-to-understand graphics.
Here's what those eight key KPIs are and why they're so important to your company and your CEO:
The 8 sales metrics your CEO wants to see
Market Qualified Leads
MQLs are those juicy, high-value leads gifted to your team from the company’s marketing department. CEOs want to know how many MQLs are entering the funnel because they generally come in at the top, and are one of the earliest possible indicators of future revenue growth (or decline).
Missing MQL targets could mean missing revenue targets in the coming months. Bringing in more MQLs than expected, meanwhile, is usually a sign of robust revenue growth ahead.
Average Deal Size
Sometimes referred to as Average Purchase Value, this metric is a simple measure of your average deal value. CEOs get giddy about this one because it helps them understand what kinds of deals your team is closing, and who the company’s customers are.
Shrewd CEOs know that when your average deal is worth less than the market suggests it should be, your reps are probably chasing low-hanging fruit or discounting too aggressively. An unusually high average deal size indicates reps are closing risky deals that could bring major headaches down the line.
Length of Sales Cycle
This metric is vital because it’s one of the key numbers CEOs use for future projections.
Knowing exactly how long it takes deals to move through the pipeline lets your boss confidently project weekly, monthly, or quarterly sales figures. Consistent sales predictions open up all kinds of planning stability across the entire company, far beyond just the sales team.
Close Rate
Close rate tracks how many leads your team turns into deals. CEOs love this metric because it gives them an easy-to-understand window into the sales funnel, and a logical starting point for identifying and addressing issues in the sales process.
High close rates mean marketing is feeding you the right kinds of leads (and, of course, your reps are killing it). A lagging close rate often means your MQLs aren’t actually that qualified, and your reps are wasting time on them.
If you really want to impress your CEO, break your close rate down based on stages of your sales funnel, and show them exactly where you’re winning and losing the most deals.

Total Closed Deals
Total closed deals is exactly what it sounds like: the total number of deals you closed over the reporting period. It’s a more big-picture metric, making it ideal for CEOs to get a feel for the overall health of the company’s sales.
Give this metric even more power by displaying it as a list naming all the accounts you’ve closed. This can act as a handy quick-reference to show your CEO the kinds of people and companies buying your product.
Lead Source
Lead source measures the percentage of leads coming from each of your sources (organic, referral, email, etc.). At the end of the day, most CEOs just want to know they’re spending their money wisely, and lead source lets them quickly assess what’s bringing in sales, and what’s not.
Sales velocity
Sales Velocity is an easy-to-calculate number that sums up how fast the company is making money. This too-often-overlooked metric is your secret weapon for impressing your CEO because it combines several other metrics to show how efficient your sales team is.
Its real power comes when you track it over time. You can benchmark sales velocity across your sales teams, compare the effectiveness of individual reps or regions, and see how changes to the sales processes impact the business.
Learn all about sales velocity, and how to calculate yours for free, by checking out this blog post.
Total Sales
Let’s be real. At the end of the day your sales team has a single job: make money. Total sales tells your CEO if you’re doing that.
For better or for worse, total sales (which decides total revenue) is the big barometer that’s often used to measure a company’s success.
Your CEO needs to know this because it feeds directly into the company’s narrative. It’s almost always the first number they’ll show investors, shareholders, the board of directors, or anyone else who wants to know how the company is doing.
The best sales report they’ve ever seen
No matter how good your numbers, you can’t just chuck them in a spreadsheet and hope to have an impact. You need something that looks good, is easy to understand, and won’t be a nightmare to build.
What’s your CEO going to respond to better? This:
Or this:
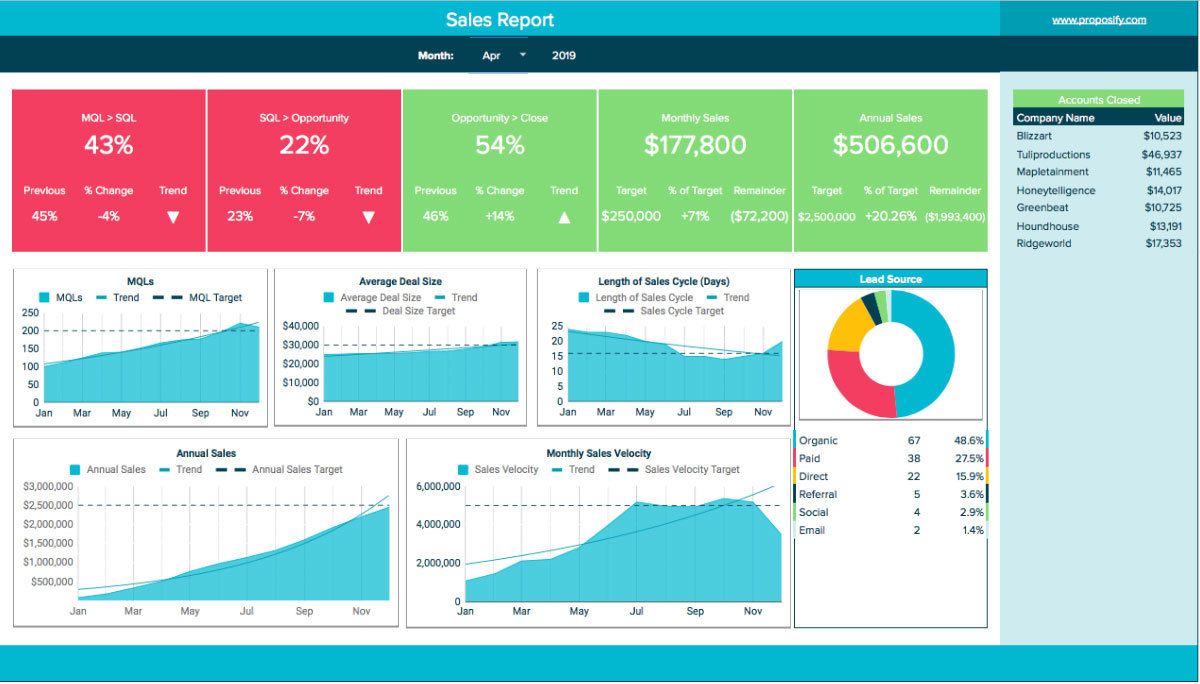
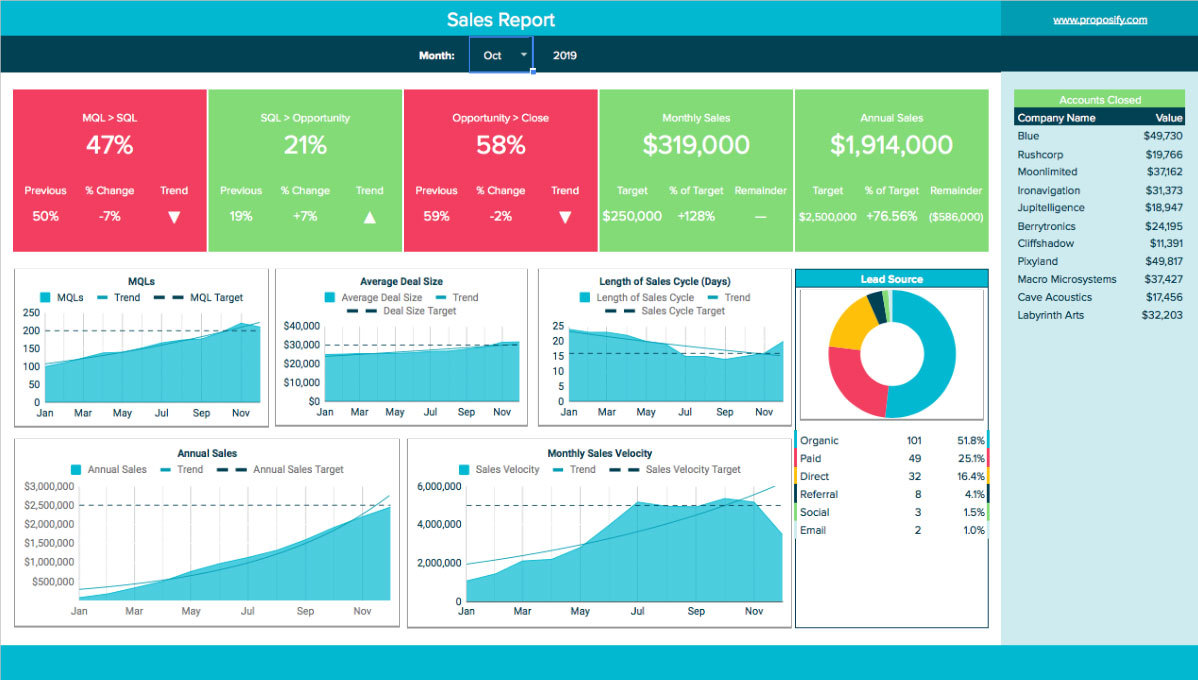
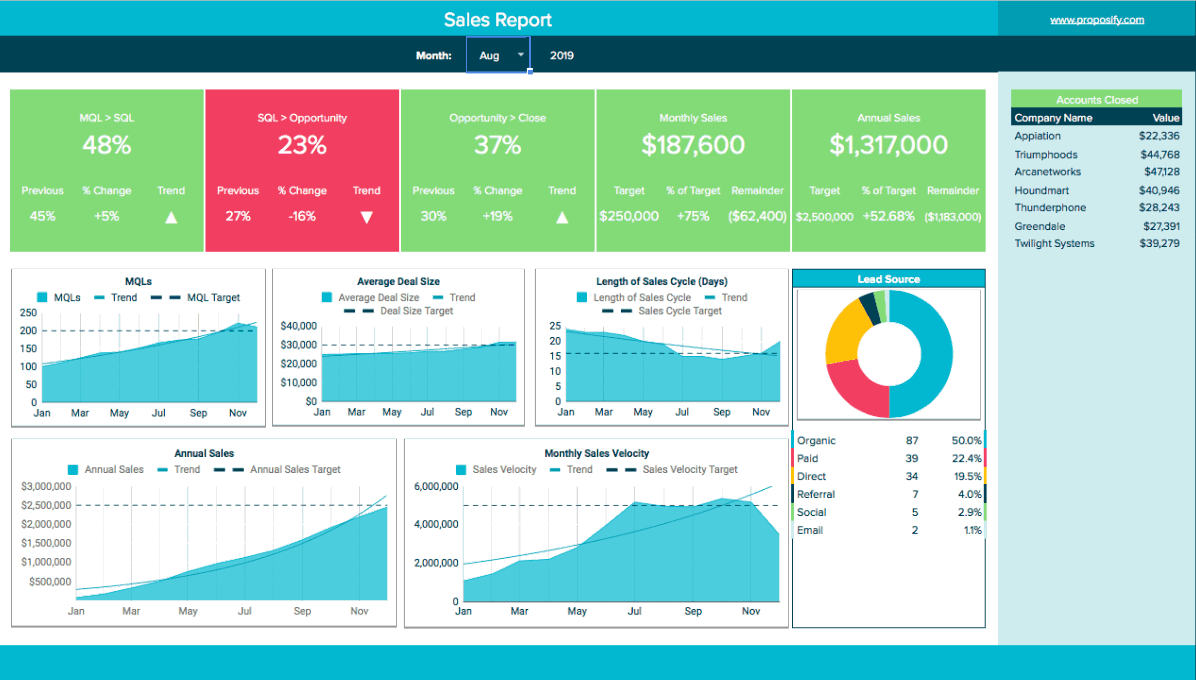
This first option is Proposify’s interactive CEO Sales Report (you can download the free template and create your own here).
The report shows your boss the exact information they want to see in a dashboard that’s powerful enough to get your point across, but paired down enough for them to digest.
It even automatically calculates the eight most important CEO metrics the instant you put in your sales data.
How to use it
When you first open the dashboard, you’ll see a welcome screen with five tabs at the bottom that let you navigate between the home screen, the dashboard itself, and the spreadsheets where you enter your sales data.
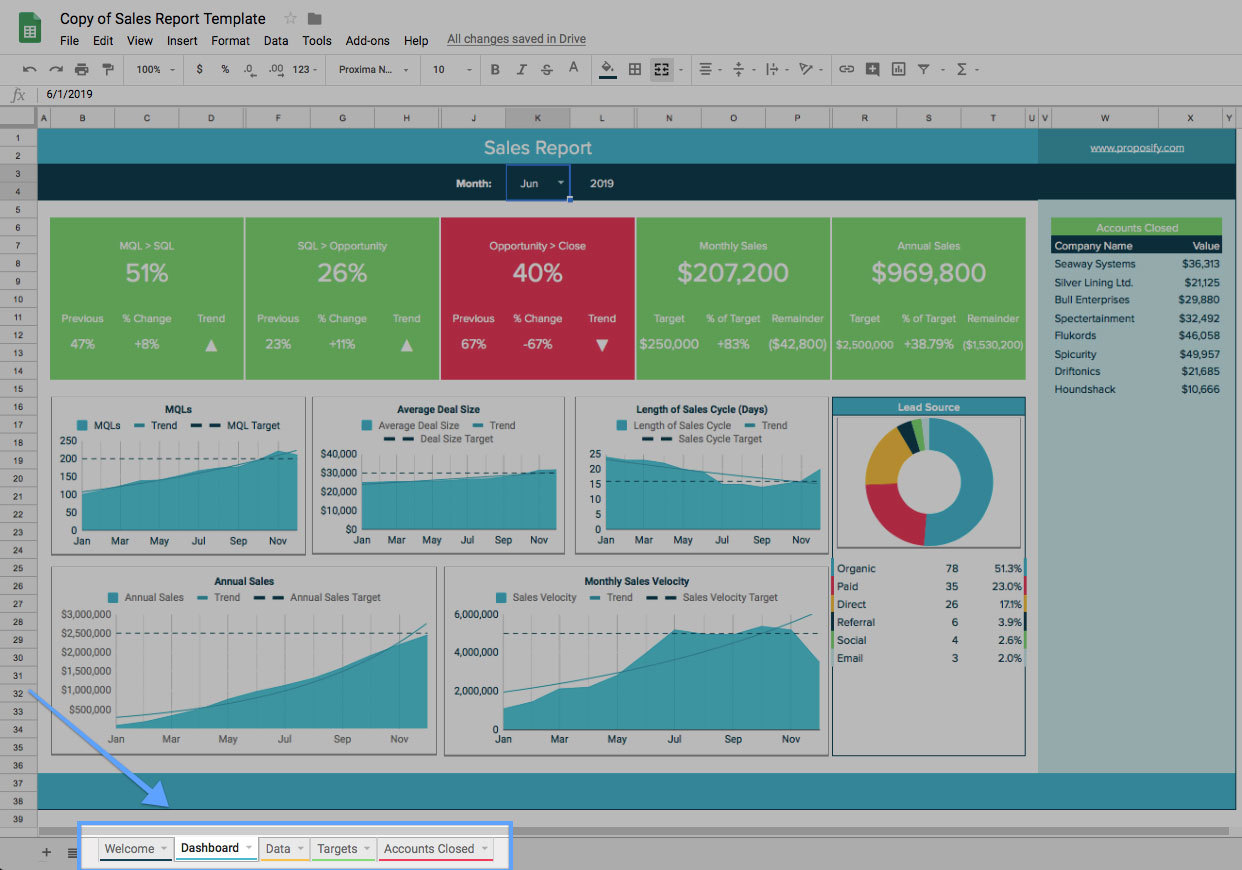
The Dashboard tab, which contains the actual report, breaks down and colour-codes your metrics to show your sales trends, and how they match up against your targets.
We’ve populated the report with some basic data to start, but you’ll want to get rid of that and enter your own.
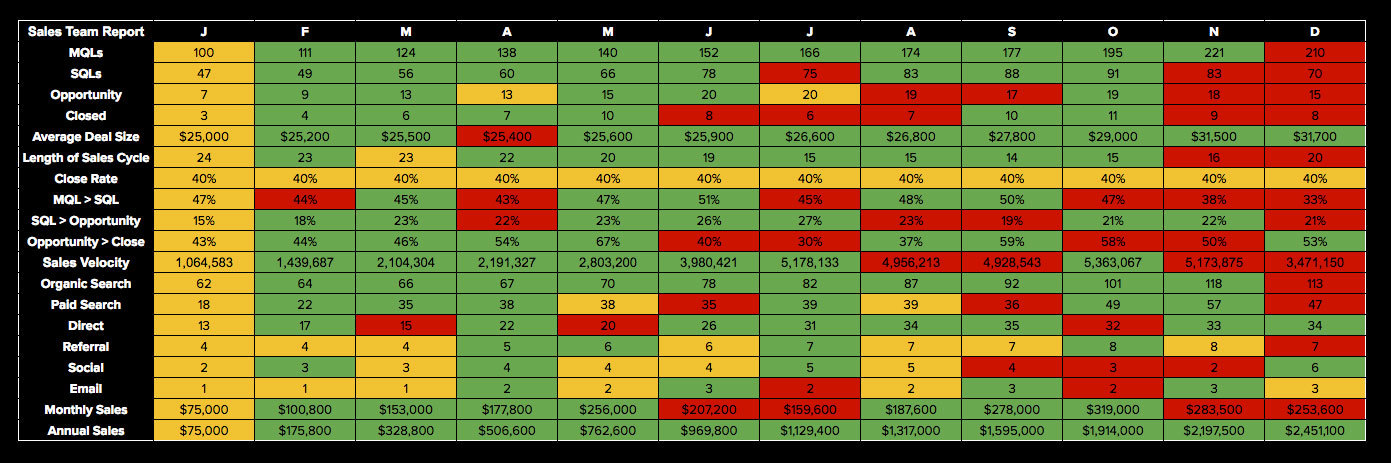
Updating the dashboard is as simple as plunking your sales numbers into the Data tab.
Clear out the old data by highlighting and deleting everything. Then, simply click the individual cells and enter in the appropriate numbers for each month.
Use the same process in the Targets tab to set your monthly and yearly targets.
The Accounts Closed tab is where you list the accounts you’ve won and the dates you closed them. Keep this updated and your dashboard will always show a quick reference of which deals closed in which months.
Now, click back to your Dashboard screen, where all your numbers and accounts will automatically display as trends and graphs. Switch from month to month with the dropdown menu at the very top of the screen, and watch the dashboard automatically update to reflect the trends.
Once you’ve input your data, you can share your interactive report by clicking on the “Share” button at the top right of the Dashboard screen.
If you prefer a static copy, you can download one by clicking “Download as PDF” from the File menu at the top left of the Dashboard screen.
However you share it, your new sales report is the perfect way to capture your CEO’s attention. They get the exact information they need to make important, high level decisions; you get a hassle-free way to deliver it consistently and show off the progress your sales team is making.
Click here to download it today for free, and give your boss the best sales report they’ve ever seen.


